~ 7 min
8/21/2026
ROI on Ozon: how to calculate payback and assess the real efficiency of your store
ROI on Ozon shows how profitably a store uses the money invested in sales. Essentially, it answers the question: how much net profit does each ruble of costs bring, taking into account all major expenses.
What is ROI on Ozon
ROI (Return on Investment) is a metric that shows the relationship between profit and invested funds.
It is needed to assess not only the amount of money earned, but also the cost of that result.
Two periods can yield the same net profit but require different amounts of costs — and then the efficiency will be different.
Example:
in one month, a store earned 100,000 ₽ in net profit with costs of 300,000 ₽;
in another, the same 100,000 ₽, but with costs of 500,000 ₽.
Let's calculate:
first month:
ROI = 100,000 × 100% / 300,000 = 33.3%
second month:
ROI = 100,000 × 100% / 500,000 = 20%
Profit is the same, but the return on investment in the first case is noticeably higher. Therefore, simple growth in gross revenue or even net profit does not yet guarantee that the business has become more efficient — ROI is needed for that.
Example of calculating ROI for a store on Ozon
To understand how the formula works in practice, let's look at a specific example for a month:
net profit — 180,000 ₽;
marketplace services — 120,000 ₽;
cost price — 350,000 ₽;
external expenses — 50,000 ₽;
tax — 30,000 ₽.
First, add up all costs:
120,000 + 350,000 + 50,000 + 30,000 = 550,000 ₽
Next, calculate ROI:
ROI = 180,000 × 100% / 550,000 ≈ 32.7%
This means the store returned about 32.7 ₽ of net profit for every 100 ₽ invested in major expenses during the month. That is the return on investment for the period.
Why a seller on Ozon should track ROI
ROI helps distinguish "growth for the sake of turnover" from real improvement in the store's economics.
For example, monthly gross revenue grew by 30%. From the outside, this looks like success, but internally, several things could have happened simultaneously:
commissions and logistics fees increased;
purchase prices went up;
advertising costs rose;
new external expenses appeared;
the tax burden increased.
As a result, turnover is higher, but the return on every ruble invested is lower.
ROI shows exactly whether real efficiency growth occurred or whether the store simply became more expensive to maintain.
Why it's important to look at ROI dynamics across periods
By itself, a single ROI number says almost nothing. It's much more useful to compare the metric over time and in "before/after" scenarios of different management decisions.
ROI is convenient for comparing:
one month with another;
quarters with each other;
the current period with the previous one;
periods before and after price changes;
periods before and after launching ads;
different seasons (e.g., summer and winter).
Example of dynamics:
May — ROI 28%;
June — ROI 35%;
July — ROI 21%.
A sharp drop to 21% signals that efficiency has declined, even if gross revenue or profit in absolute figures hasn't fallen.
Next, the seller's task is to see what changed:
did the cost price increase;
did marketplace expenses rise;
did external costs change;
did taxes go up;
did net profit fall.
With this approach, ROI stops being just a "line in a report" and becomes an indicator that helps find the cause of deterioration or confirm the success of changes.
How to track ROI for your entire store on Ozon via Torgstat
In Torgstat, you can analyze ROI not only for specific products or groups, but also for the entire store on Ozon as a whole.
This is convenient when you need to assess the overall return on investment of the business: how much net profit the entire store generates relative to all major costs for the period.
In Torgstat, ROI for a store on Ozon is calculated using the formula:
ROI = Net profit × 100% / (Marketplace services + Cost price + External expenses + Tax)
In addition to the ROI value itself, Torgstat offers comparison across different periods, for example:
current month vs previous;
ROI before and after changing retail prices;
ROI before and after cost increases (e.g., advertising or logistics);
ROI before and after assortment optimization;
comparison of seasonal periods with each other.
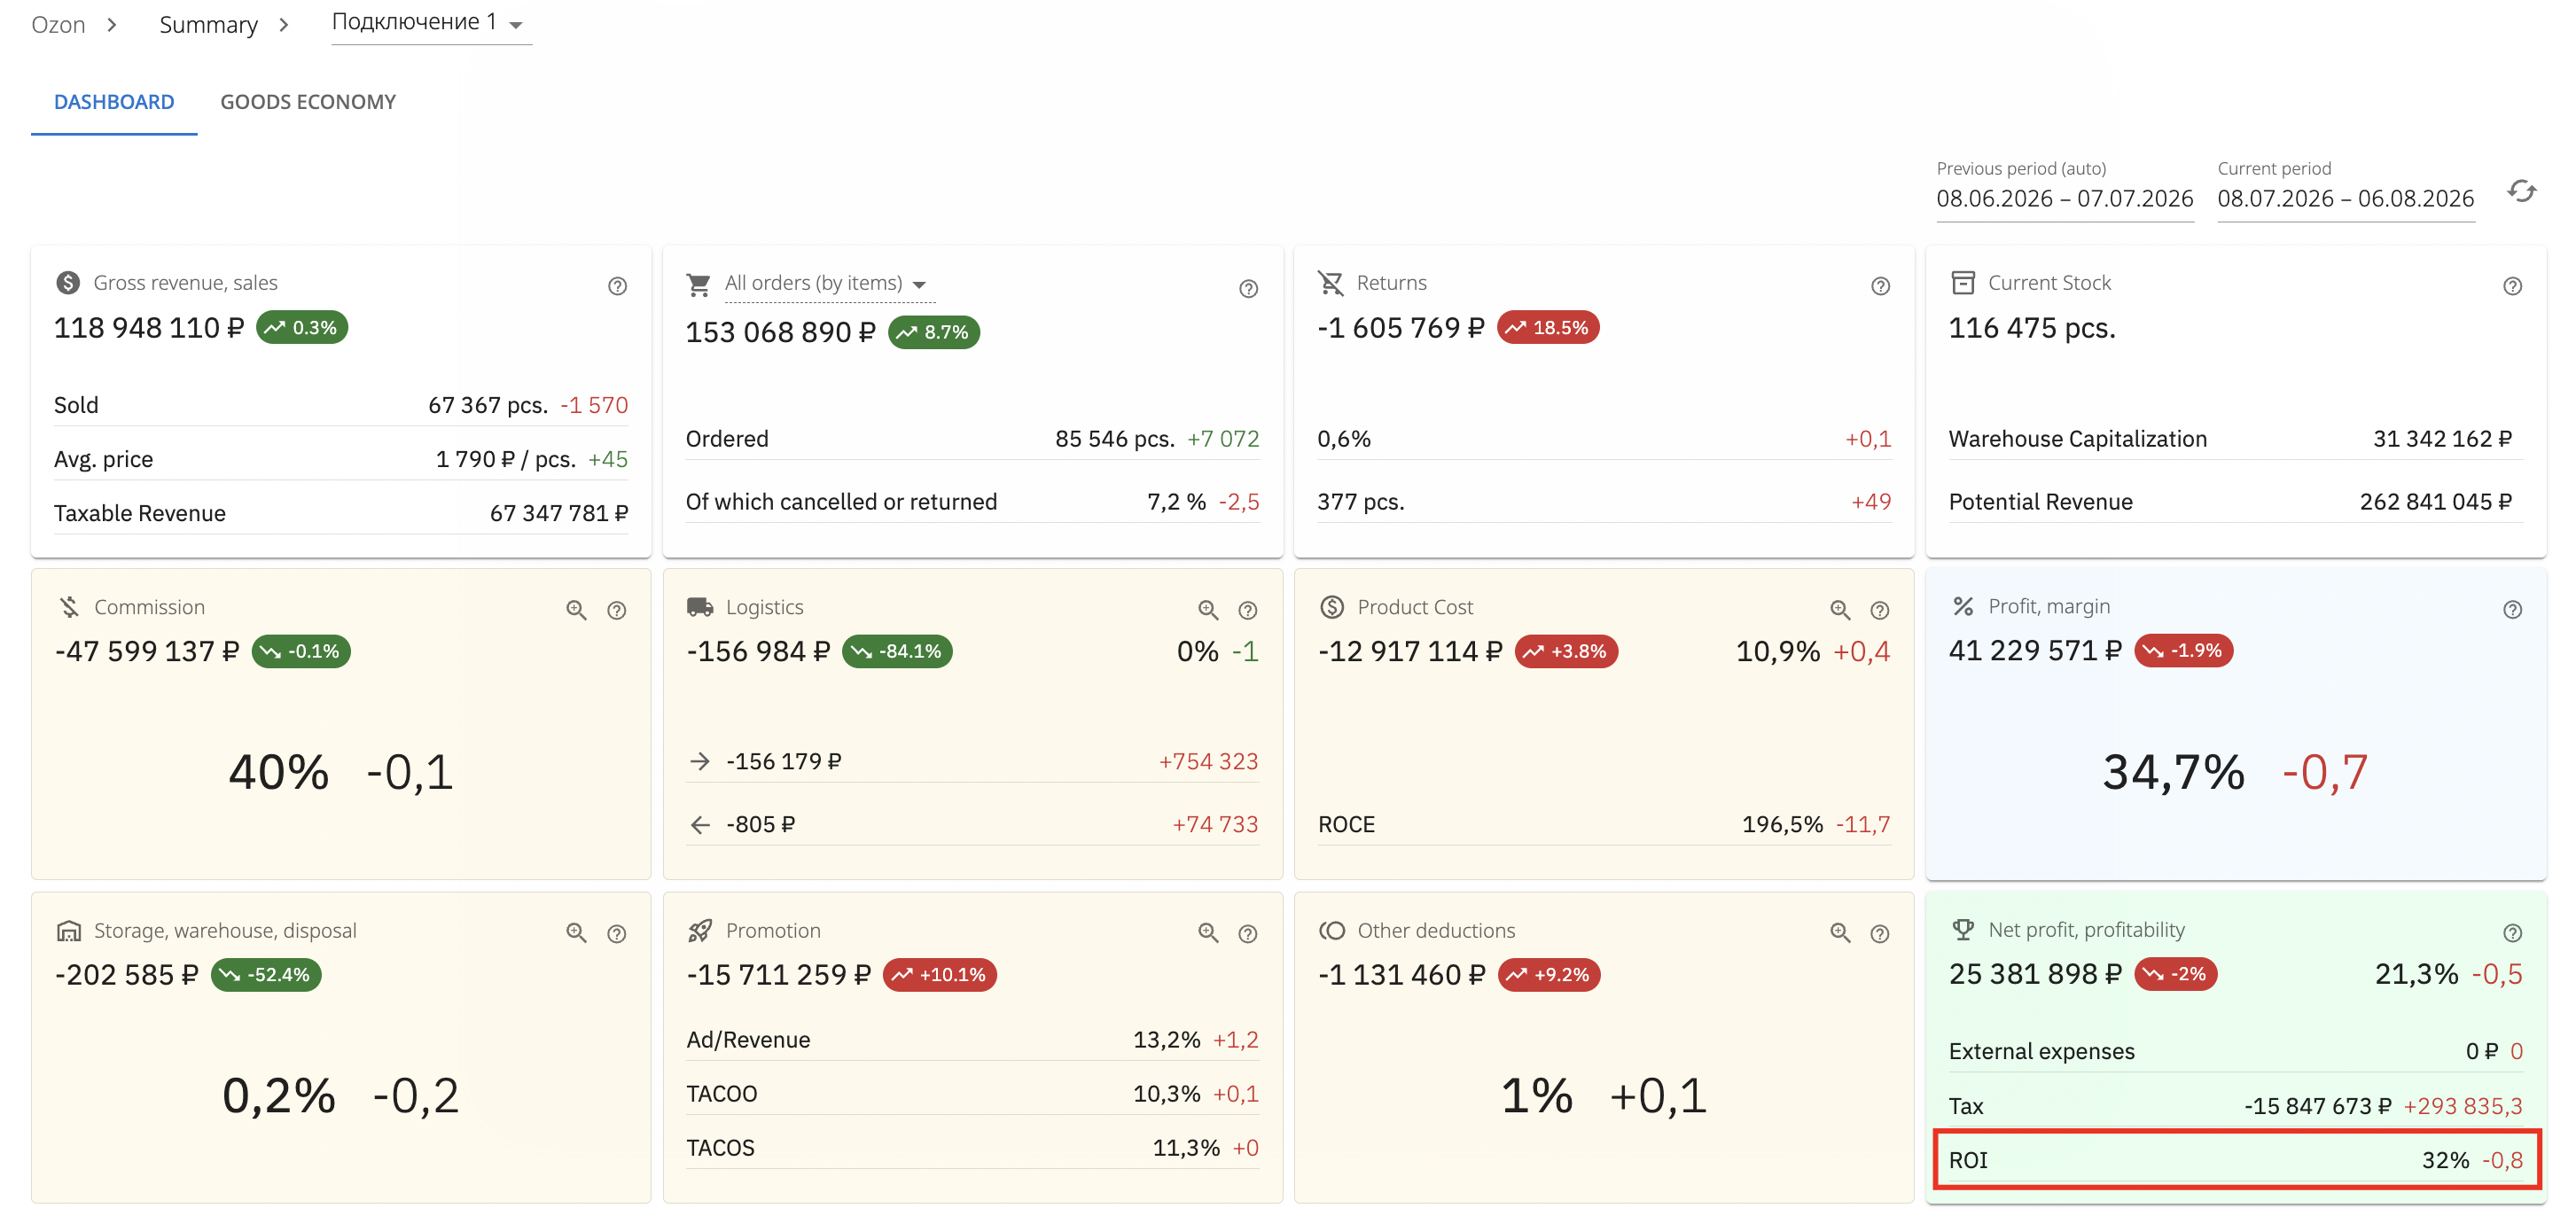
For large stores, this is critical: changes in individual products can get "lost" against the backdrop of total revenue, while aggregated ROI shows whether the business economics have improved overall.
Why ROI may decline
A drop in ROI means the store is earning less net profit per unit of cost. There can be several reasons, and they often overlap.
Rising cost price
If suppliers raised purchase prices or the purchasing structure changed, the cost price of sold goods increases.
If retail prices are not raised or not raised enough, the margin on each sale decreases, and ROI follows suit.
Increase in marketplace expenses
Growth in commissions, logistics fees, paid services, and other Ozon services directly pressures profit.
Even if gross revenue and order volume don't decline, the additional cost burden can reduce ROI.
Growth in external expenses
When the following increase:
payroll;
costs of contractors and services;
packaging, warehouse, and similar expenses,
the total amount of investments becomes larger. If net profit doesn't grow at least at the same pace, ROI naturally falls.
Reduction in retail prices
Lowering prices often generates more orders and gross revenue, but it reduces profit per product.
A situation may arise:
turnover grows;
the number of shipments grows;
but ROI and net profit per ruble of costs decline.
This is a typical example of why focusing only on gross revenue is dangerous.
Irrational advertising
Advertising that brings orders but costs too much "eats up" a significant portion of profit.
If advertising costs grow faster than the additional profit from acquired customers, ROI falls, even if sales volumes are growing.
Increase in the share of returns
A rise in the number of returns:
reduces final profit;
increases logistics and processing costs;
distorts the real economic result.
With a large number of returns, ROI may decline even if shipment revenue looks normal.
How to increase ROI for a store on Ozon
ROI can be increased in two ways: by increasing net profit or by reducing costs (without tanking sales).
Most often, a combination of approaches is used.
Working with cost price
Reducing the cost price directly increases profit per sale. To do this, you can:
review the pool of suppliers;
negotiate better terms with larger purchase volumes;
optimize logistics to the warehouse;
change packaging or product configuration where possible without losing product value.
Even a small reduction in cost price with a large number of orders noticeably affects overall ROI.
Optimizing marketplace expenses
It makes sense to break down all Ozon expenses by category and understand where the main growth is happening. Common optimization points:
supply scheme (FBO/FBS, supply frequency, batch sizes);
warehouse storage;
paid options that the store barely uses but continues to pay for.
The goal is to maintain sales while reducing "overheated" cost items.
Controlling external expenses
External expenses should be considered together with data from the seller dashboard. Only then can you see the full economic picture.
If you analyze only metrics within Ozon, the store may seem profitable, but after adding salaries, rent, and other costs, ROI may turn out to be much lower.
Reviewing pricing policy
If a product sells steadily, it's sometimes wiser to raise the price slightly, sacrificing some volume but increasing profit per unit.
The result should be evaluated through:
changes in net profit;
ROI dynamics;
rather than only through turnover and order volume.
Optimizing advertising
Effective advertising should not just bring orders — it should improve the final economics.
If ad campaigns increase gross revenue but barely affect net profit (or even reduce it after accounting for promotion costs), such campaigns should be:
turned off;
reallocated in budget;
changed in strategy and creatives.
The goal is for additional advertising investments to raise ROI, not drag it down.
Working with an inefficient assortment
Part of the assortment can generate turnover but bring almost no net profit or even drag it down.
For such items, it's useful to:
calculate profit and ROI separately;
raise prices or reduce cost price as needed;
review storage and logistics terms;
decide whether it makes sense to continue selling that product.
Eliminating or improving unprofitable/low-profit items helps increase the ROI of the entire store.
How ROI differs from margin
ROI and margin are both related to profit, but they answer different questions.
Margin shows what portion of gross revenue is profit:
Margin = Profit × 100% / Gross revenue
This is a "markup" indicator relative to gross revenue.
ROI shows how efficiently investments are recouped:
ROI = Net profit × 100% / Costs
A store can have high product margins, but at the same time:
take a long time to recoup invested money;
carry large external expenses;
pay high commissions and taxes.
Therefore, for a full assessment of business economics, it's better to look at both margin and ROI simultaneously.
ROI and profit: what's the difference
Profit answers the question "how much money is left," while ROI answers "how profitably did the investments perform."
Both metrics are needed because high absolute income doesn't always mean high capital efficiency.
Example:
Store A
net profit — 200,000 ₽;
costs — 400,000 ₽;
ROI = 200,000 × 100% / 400,000 = 50%.
Store B
net profit — 300,000 ₽;
costs — 1,000,000 ₽;
ROI = 300,000 × 100% / 1,000,000 = 30%.
Store B earned more in rubles, but Store A uses money more efficiently: every ruble invested brings it more profit.
Therefore, comparing businesses or your own periods only by profit or only by ROI is incorrect — you need to look at both metrics at once.
How to properly analyze ROI
Drawing conclusions from just one ROI number for one period is risky. The metric reveals itself in combination with other metrics.
It's useful to analyze ROI together with:
net profit;
gross revenue;
margin;
cost price;
marketplace expenses;
external expenses;
taxes;
sales dynamics;
share and cost of returns;
product turnover.
Examples of ambiguous situations:
ROI grew, but sales dropped significantly. The store became "lean," but may be losing market share and turnover.
ROI dropped slightly, but the business is actively scaling, with absolute profit and customer base growing significantly. In some strategies, this is acceptable or even expected.
The point of ROI analysis is not to find an "ideal value," but to understand how business efficiency changes and what drives it.
Frequently asked questions
What does ROI show on Ozon?
ROI shows how much net profit a store earns on every ruble of major costs. The higher the metric, the more efficiently investments in sales on Ozon are recouped.
Can I view ROI for the entire store on Ozon?
Yes. In Torgstat, you can analyze ROI for the entire store as a whole, not just for individual products. This allows you to assess the overall return on investment of the entire business on the platform.
Can I compare ROI across different periods?
Yes. Comparing ROI by months, quarters, and before/after changes helps you understand whether store efficiency is improving and how cost growth, price changes, and ad campaigns affect it.
What ROI on Ozon is considered good?
There is no single "normal" value. An acceptable ROI depends on the category, business model, cost level, and turnover. It's more useful to compare the metric with previous periods and the store's own goals.
Why can ROI decline while sales grow?
Because along with gross revenue growth, cost price, commissions, logistics, advertising, taxes, and other expenses can grow faster. In this case, turnover increases, but the return on every ruble invested falls.
Can ROI be negative?
Yes. If a store had negative net profit for a period, ROI will also be negative. This means costs were not recouped and the business operated at a loss.